
"Son of Ida" may have brought record storm tides to lower Bay
 New VIMS Pier VIMS' new concrete pier performed as designed, suffering no damage during the nor'easter. The pier deck sits 13 feet above mean sea level. Photo by David Malmquist.
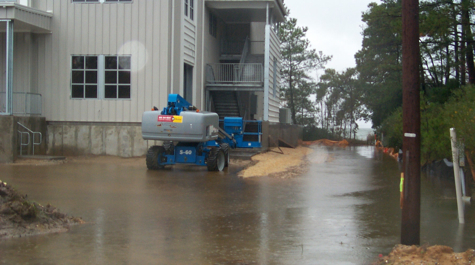 Vessels Operation Center The new Vessels Operation Center at VIMS was built on an elevated foundation to avoid storm-surge flooding. 7:59 am on Thursday, November 12, 2009. Photo by Ron Herzick.
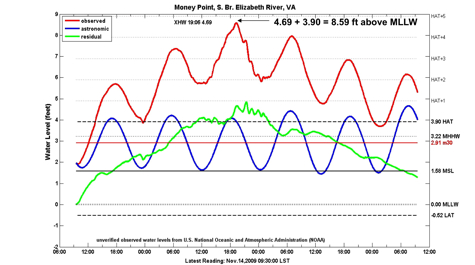 Money Point The maximum storm tide recorded at Money Point on the Elizabeth River was about 8.6 feet above MLLW, about 0.3 feet higher than Isabel's maximum storm tide at that station and perhaps the highest water level ever recorded in the lower Bay. Chart courtesy Dr. John Boon
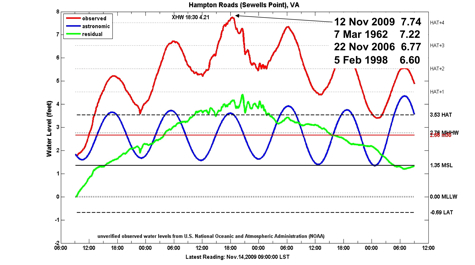 Sewells Point Although the water levels are not yet verified, the storm-tide of 7.74 feet above mean lower low water (MLLW) at Sewells Point will likely set a record for extra-tropical storms there. Also shown are the second, third, and fourth highest nor'easter storm tides and their dates of occurrence at Sewells Point. Of these 4 extremes for nor'easters in a record going back 80 years, 3 have occurred in the last 11 years. Chart courtesy Dr. John Boon
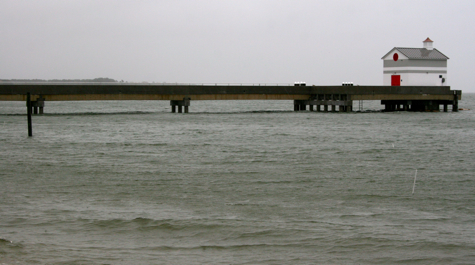
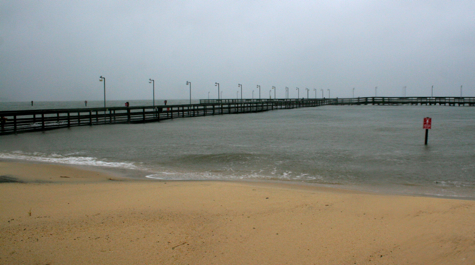 Gloucester Point Fishing Pier Flood waters impinge on the Gloucester Point Public Fishing Pier. 9:22 am on Thursday, November 12, 2009.
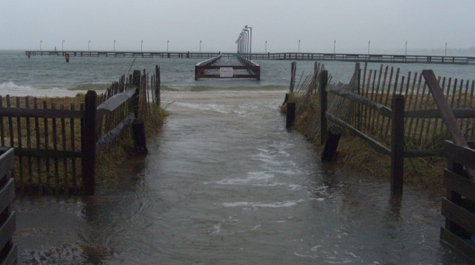 The Gloucester Point Public Fishing Pier. Thursday, Nov 12 2009 at 4:29 pm EST. Photo by David Forrest.
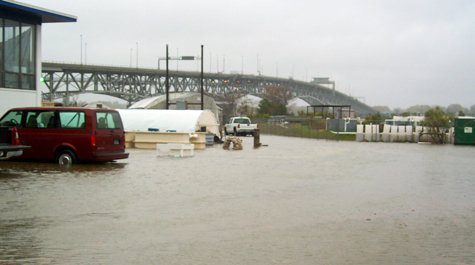 Boat Basin The VIMS Boat Basin. 8:03 am. Thursday, November 12, 2009. Photo by Ron Herzick.
Facility improvements at VIMS help minimize damage
The strong nor'easter that affected the mid-Atlantic coast last week may have produced the highest storm tide ever recorded in lower Chesapeake Bay.
Preliminary data from NOAA's National Ocean Service shows that the maximum storm tide recorded at Money Point on the Elizabeth River was 8.59 feet above mean lower low water.
Tide expert John Boon, professor emeritus at the Virginia Institute of Marine Science, says that's 0.3 feet higher than the previous record storm tide measured at this location during Hurricane Isabel in September 2003. He cautions that the tidal data have not yet been verified, a process that typically takes 3 to 4 weeks.
A "storm tide" combines storm surge—the water piled up by a storm's winds—with the normal astronomic tide. Storms that peak during high astronomic tides produce higher storm tides than storms that peak during low astronomic tides.
Although the storm tide from the "Son of Ida" brought more than 2 feet of water into the VIMS Boat Basin, rivaling the flooding levels experienced during Isabel and Tropical Storm Ernesto in 2006, VIMS' new concrete pier and Vessels Operation Center emerged unscathed.
The structures, designed to replace the VIMS Ferry Pier and older buildings in the VIMS Boat Basin after they were damaged during the previous storms, were purposefully elevated to minimize storm-related damage. The concrete pier's deck stands 13 feet above sea level. The Vessels Operation Center was built on a foundation that is raised 10 feet above sea level.
Carolyn Cook, Director for Planning and Budget at VIMS, says the improvements “reflect good planning on the part of the Governor and the General Assembly, and provided significant savings to the Commonwealth.” Isabel’s damage at VIMS exceeded $2 million. Ernesto's damage was around $200,000. Cook estimates damage from the recent storm at less than $30,000.
Last week's storm, a remnant of Hurricane Ida that re-intensified and then stalled off the mid-Atlantic coast for more than 3 days, brought strong on-shore winds that subjected local shorelines to storm surge during 6 successive high-tide cycles. The resulting storm tides, combined with runoff from 6-8 inches of rainfall, produced record flooding on Bay and ocean shorelines in Virginia.
Sewells Point, NOAA's main tide station for Hampton Roads, recorded a storm tide of 7.74 feet above mean lower low water during the storm. Boon says this likely sets a record for nor'easters for this location, where instruments have been recording water levels since 1927. Previous storm-tide records at Sewells Point occurred during the Ash Wednesday storm of March 1962, when water levels reached 7.22 feet, in November 2006 (6.77 ft.), and in February 1998 (6.60 ft.).
Boon says "It's interesting that of the 4 extremes for nor'easters in a record going back 80 years, 3 have occurred in the last 11 years." Part of the reason for the recent spate of record storm tides is sea-level rise, which has raised water levels in Hampton Roads by about 1.2 feet since 1930.
| Yellow markers show location of tidal gauges. View larger map |
The storm tide at the U.S. Coast Guard pier on the York River peaked at 6.86 feet above mean lower low water at 6:30 pm EST on Thursday November 12th. That compares to 6.01 ft during Tropical Storm Ernesto in September 2006 and 6.12 ft. during a nor'easter in October 2006.
Buoys operated by the Virginia Estuarine and Coastal Ocean Observing System (VECOS)—a joint venture between VIMS, the Virginia Department of Environmental Quality, NOAA, and the Hampton Roads Sanitation District—gave further information about the storm's waves and winds.
The VECOS buoy at the Goodwin Islands near the mouth of the York River recorded waves of 6 feet (1.75 m), and showed that waves stayed above 3 feet (1 m) for 72 hours. Waves were passing the buoy about every 4 seconds. Maximum sustained winds were at 42 mph, with 56-mph gusts.
The VECOS buoy at Gloucester Point recorded waves of 1.8 feet (0.55 m), with maximum sustained winds of 48 mph. Winds stayed consistently above 25 mph for almost 48 hours. In comparison, Tropical Storm Ernesto brought maximum winds of 58 miles per hour and waves of 0.8 meters (~3 feet), whereas Hurricane Isabel had 65-mph sustained winds, 90-mph gusts, and a 7-foot storm tide topped by 6-foot waves.
Extratidal High Water
Storm tides are typically measured in relation to mean lower low water (MLLW), a 20-year average of the lower of the two daily low tides. MLLW values are established by NOAA's National Ocean Service, and provide a good reference point for mariners concerned with running aground on a shoal during low tides.
Boon, however, contends that MLLW is a poor reference for storm-tide flooding. He instead prefers to refer storm-tide levels to the highest astronomic tide, or HAT. HAT marks the highest water level predicted by tide charts, and thus provides a more familiar benchmark to waterfront property owners, who have likely learned through daily experience where the HAT level lies on their property, and adapted accordingly in terms of construction and landscaping.
Extratidal high water refers to any water level that exceeds the highest astronomic tide. "These extremes occur only in the presence of a ‘storm surge,'" says Boon, "and provide a much more meaningful reference point for coastal interests, as they indicate the effective flooding."
Using Boon's scheme, storm tides during last week's nor'easter were 4.69 feet above HAT at Money Point, 4.21 feet above HAT at Sewells Point, and 3.62 feet above HAT at the U.S. Coast Guard facility in Yorktown. These values translate directly into the depth of floodwaters affecting land at each location. For more on HAT and extratidal high water, visit www.vims.edu/bayinfo/tidewatch.
| Storm | Storm Tide @ Sewells Point (MLLW) | Storm Tide @ USCG (MLLW) | Maximum Sustained Winds (mph) | Maximum Gust (mph) | Significant Wave Heights (m) | Rainfall (inches) |
| "Ida" | 7.74 | 6.86 | 42 | 56 | 0.55 | 6-8 |
| Ernesto | 5.53 | 6.01 | 35 | 58 | 0.8 | 3.9 |
| Isabel | 7.89 | No data | 65 | 90 | 2.0 | 2.2 |